The Business Intelligence revolution - the new store experience KPIs
Discover Ispira integration of technology and expert advice to deliver unique improvements to your Retail Experience, Download our White Paper
Store Analytics tells a retailer what is happening in its stores, shows which store performance KPIs need to be improved in those stores and activates root cause interpretation of the actions that can be taken
Insights:
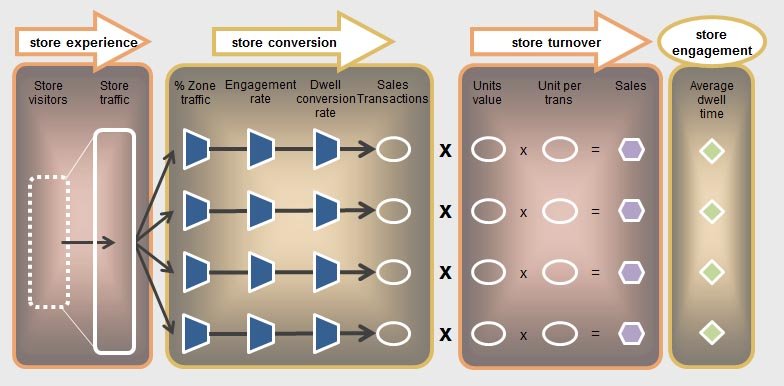
Zone Traffic – traffic in each zone of the store
Zone Dwells - number of customers interacting with product
Dwell Times - average time spent engaging with specific displays
Purchase by zone – number of units sold in each area
KPIs – Store traffic to Zone traffic, Traffic to Dwell, Dwell to purchase
Path to Purchase
Best Practice Action Plan
With our root cause analysis driven by data, best practice benchmarking, innovative approach we develop the Best Practice Action Plan which delivers the financial improvements
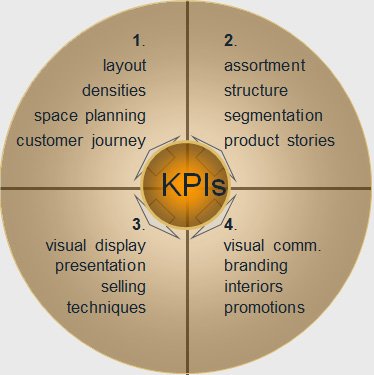
Opportunities for store performance improvement fall into 4 main disciplines…
1. Layout, Densities, Space planning, customer journey
2. Product assortment structure, segmentation, product stories
3. Visual display, presentation tools, selling techniques
4. Visual comm, Branding, Interior design, Promotions
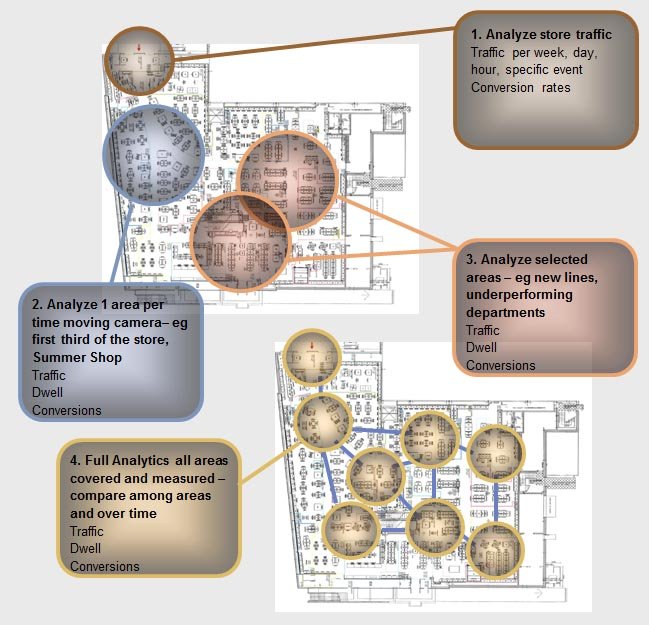
Retailers can now choose 4 types of rollout:
- Store traffic - people counting at the entrance compared to store sales
- Movable analytics – understand quickly and cost-effectively what is happening in a specific area of a store, move cameras periodically to different areas of the store
- Selected analytics – install cameras in selected departments to measure KPIs and to develop improvement actions on a limited number of areas in the store
- Full analytics – measure KPIs and activate actions for all store departments. Test new store design, compare different formats, clusters, layouts. Measure return on store marketing actions and on visual communications initiatives

Contact us to identify the right initiative for your business. Typical project scopes:
1. Remote VM training - Monitor, train live, check progress and compliance
2. Remote customer service training - Monitor dwell time, behavior, posture
3. Replace Observational research - Build quantitative data to analyze customer behavior
4. Introduce new lines/product categories - Compare KPIs and improve performance
5. New store design/ store layout - Compare KPIs among formats and improve performance
6. Compare store clusters/grades - Compare KPIs across clusters/grade and improve performance
7. Improve Visual Merchandising - Improve techniques, balance density, coordination
8. Improve Retail Calendar performance - Improve ROI of store marketing campaigns
For more information Download our White Paper

